Hidden Options
There are a number of settings and preferences in the application that are not available directly. These are called hidden options and can be accessed by holding Ctrl + O in the regular settings dialog. This will bring up another dialog where you can fine-tune NetWorx as you like.
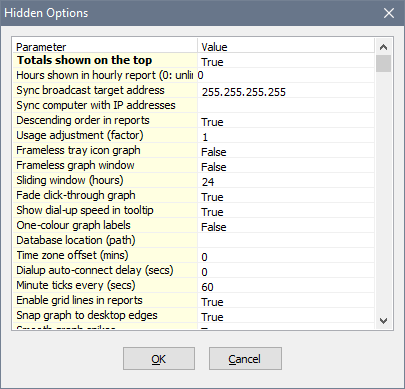
The settings are as follows:
- Totals shown on the top determines where the total row is located in the usage reports, either the first or the last row.
- Hours shown in hourly report sets how many hours back from now are displayed in the hourly report.
- Sync broadcast target address determines to what broadcast IP address the application sends the discovery packets. If your PC has more than one network adapter and you have turned the usage synchronisation on, you may need to change this parameter to the correct address, e.g. 192.168.0.255.
- Sync computers with IP address, just like the previous setting, only applies when you have turned usage synchronisation on. In some networks automatic discovery of other nodes falls flat due to firewalls or network configuration. In this case, you can manually specify one or more space-separated IP addresses of the computers that the application must synchronise with.
- Descending order in reports sets whether the newest or the oldest records are shown first in the usage reports.
- Usage adjustment factor applies a numeric coefficient to all usage reports by multiplying all records by this number. You can adjust this coefficient if your ISP’s readings are consistently a bit higher or lower than those reported by NetWorx and you want to equalise them. This does not affect the actual records in the database, so don’t be afraid to experiment.
- Frameless tray icon graph removes the 1-pixel border around the graph in the taskbar notification area icon, when you chose to display that graph.
- Sliding window. Some ISPs only allow you to download a certain amount within past N hours or days. If this is the case, enter the period in hours in this field. Then you can go to the usage reports and choose Display - Last N hours, so that you can keep an eye on your usage in such a rolling period.
- Fade click-through graph determines whether the graph fades out when it is in the click-though mode and you are hovering it.
- Show dial-up speed in tooltip displays the names and speed of established dial-up connections, including mobile broadband, when you click the application’s icon in the taskbar notification area (system tray).
- One-colour graph labels: if this is set to True, current transfer rates displayed under the graph will be monochrome. Otherwise, they will be the same colour as the graph lines.
- Database location. Normally NetWorx stores the usage data in a special folder available to all users in the system. In some cases though, you may want to move the database to another folder. Examples include backup purposes or a dual-boot system where you may want to monitor the usage in different operating systems. If this is the case, specify a folder where you want to store the usage data. This folder must be writable.
- Time-zone offset. When classifying traffic as on-peak and off-peak, NetWorx uses the local time on your computer. Sometimes though, your ISP may use a different time-zone, for example if it is in a different state. This feature can add or subtract a number of minutes from your local time to compensate for the ISP’s clock.
- Dialup auto-connect delay. If you are using mobile broadband, it usually takes time for the modem to find a network and connect to it. In this case, the attempts to dial a connection before the network is found would fail. Here you can specify a delay before NetWorx attempts to establish a dial-up connection, thus letting the modem find a network.
- Minute ticks every. You can turn the minute ticks on or off in the graph settings, and if you wish to have ticks at a different interval, say every 30 seconds, specify it here.
- Enable grid lines in reports turns the grid lines in the usage reports on or off.
- Snap to desktop edges: when turned on, NetWorx Graph will snap to a desktop edge when you move it close enough.
- Smooth spikes makes the graph look better by smoothing and averaging the bursts, though the graph loses some of its precision.
- No. of digits after decimal sets the amount of digits after the decimal point in numbers throughout the application. For example, a value of 4 would format the numbers as 0.0000.
- Dial-up check ping IP address: when checking whether a dial-up connection hangs the application, pings the ISP’s gateway server unless you specify a different address here.
- Dial-up check ping timeout determines the number of seconds the application waits for a response in the dial-up status check.
- Logged user usage only: if this is set to True, NetWorx displays only currently logged user’s usage throughout the application.
- Usage hotkey opens quota dialog: when set to True, hitting the usage hotkey will open the quota dialog instead of the usage dialog.
- Force rate unit: when set to 1, all data rates will be displayed in kB/s. When set to 2, all data rates will be displayed in MB/s.
- Router SNMP version: choose which version of the SNMP protocol NetWorx should use to pull the data from your router.
- Router SNMP v1 and v2 community: when monitoring a router and the version is 0, 1 or 2, NetWorx will use this string in SNMP queries. This is normally “public” unless your router is configured otherwise.
- Router SNMP v3 connection string: when monitoring a router and the version is 3, NetWorx will use these parameters in SNMP queries.
The connection string has the following format:
username:(noAuthNoPriv|authNoPriv|authPriv)
Add (md5|sha1):authpass for authNoPriv and authPriv
Add (md5|sha1):authpass:(des|3des|aes):privpass for authPrivExamples:
admin:noAuthNoPriv
admin:authNoPriv:md5:secret
admin:authPriv:md5:secret:des:topsecret - Router poll interval (ms). Some routers don’t stand frequent requests and crash. If this happens, you can poll it less frequently. This breaks the real time usage graph, but the aggregated usage data remains correct.
- Use thousand separator sets whether or not NetWorx should use the thousand separator when displaying large numbers.
- Overlay desk band numbers determines whether to paint the rate values in the desk band over the graph (True), or under it (False).
- Mean samples sets how many readings are used to calculate the current transfer rate. The default value is 5 samples, equalling 5 seconds.
- Rates font size sets the size of the numeric readings for the graph and the desk band.
- Hide notification area icon: when this is set to True, there is no NetWorx in the notification area. In this case, NetWorx is still running and can be accessed by choosing NetWorx from the start menu.
- Swap upload and download. Sometimes, when monitoring a router, the upload and download readings may be reversed. Set this option to True to reverse them back to normal.
- Hide graph on full-screen apps removes the graph from the screen while a full-screen application is active.
- Keep track of TCP/UDP connections monitors how much data is transferred for each connection in NetStat. You can disable this to reduce memory usage.
- Show unit (bytes or bits) on the graph displays the current unit on the graph, either bits/s or bytes/s.
- Connection monitor timeout is a time period in seconds after which the connection monitor records an event in its log.
- Connection monitor retries is a number of consequent pings performed by the connection monitor. For example, if the timeout is set to 60s and the number of retries is set to 2, it will record an event after two successful or unsuccessful pings within one minute.
- Graph line width is the thickness of the line used in the real-time graph.
- Physical adapters only. If NetWorx does not show your network adapter, set this option to False and restart the application. By default, it hides the adapters that appear to be virtual.
- Show graph grid and axes turns the Y-axis and grid on the graph on and off.
- Show graph time stamps if ticks are on displays the time between minute ticks on the graph.
- Show features related to dial-up enables or disables the dial-up related functionality. Turn this option off if you wish to simplify NetWorx interface.
- Show features related to on/off-peak hours enables or disables hour classification. Likewise, turning this off hides the extra features if you don’t use them.
- Display file names in applications report shows executable file names in the applications report. If this option is turned off, application names are shown instead.
- Write graph data to a CSV file allows you to specify a file name for writing the current rates into.
- Graph data CSV write period determines how often the above CSV file is updated.
- Top applications and web-sites determines how many applications and web-sites are shown the report. Enter 0 to see all records.
- Activity threshold for tray graph set in bytes per second disregards background traffic when drawing the tray icon graph.
- Vertical axis at the beginning of chart displays the vertical axis either near the newest data or the oldest data on the graph.