Graph Window
The NetWorx Graph window displays the real time traffic data with the average throughput values at the bottom. You can easily see the traffic flowing through your computer’s network connection:
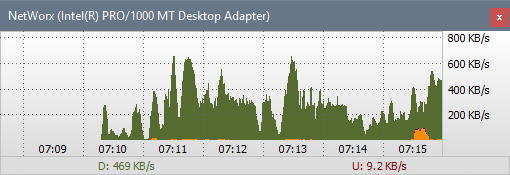
You can customise the graph and set its colours in the Graph settings.
Useful keys:
- Click the graph and use the + and - keys on the numeric keypad to adjust its transparency.
- Use the left/right arrow keys or PageUp/PageDown to travel along the graph up to 12 hours back.

A semitransparent graph is convenient for doing something else while keeping an eye on the bandwidth usage.
You can adjust the graph’s visual properties:

An example of customised graph design: Matrix-style.
You can reset or close the graph via the pop-up menu:

Finally, if you are using the installed version, NetWorx can display your bandwidth usage in the taskbar:
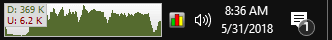
In order to turn this feature on, right-click the task bar and choose Toolbars - NetWorx Desk Band.
You may also need to unlock the taskbar to resize the graph. To do so, untick the Lock the taskbar menu item, resize the graph and lock the taskbar again.