Graph Settings
The Graph tab is for adjusting the visual appearance of the graph.
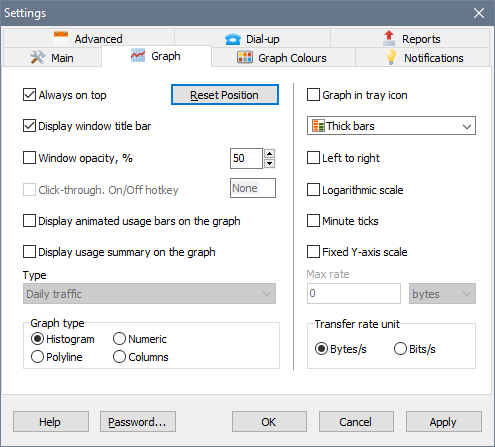
Always on top: mark this checkbox to make NetWorx Graph appear on top of all other desktop windows.
Reset Position: if the NetWorx graph happens to be shown off-screen, click this button to bring it back.
Display window title bar toggles the display of the NetWorx Graph’s title bar and borders. Clear this checkbox to save the desktop space.
Window opacity: NetWorx Graph can appear semitransparent. Specify the visibility as percentage: 10% is barely visible, and 90% is nearly opaque.
Click-through: NetWorx graph will allow you to click the objects underneath as if there was no graph window. Since in this case the graph itself is not clickable, you may want to assign a hot key to switch between the click-through mode and the normal behaviour. Additionally, the click-through mode can be toggled via the pop-up menu, provided the graph is visible and is semitransparent.
Display animated usage bars: turn this on if you want to see the additional download/upload animated bars at the right side of the graph.
Display usage summary: turn this on if you want to see daily, weekly or monthly usage on the graph.
Graph type: at your preference NetWorx graph can show usage as polylines, histogram, average columns or numeric values.
Graph in tray icon displays a tiny real-time graph in the system tray, next to the clock (taskbar notification area).
Left to right displays usage history graph left to right rather than right to left.
Logarithmic scale displays the graph in the logarithmic scale instead of linear. This setting is useful for monitoring small values, and for the graphs with a large difference between download and upload rates.
Minute ticks shows the vertical lines of minute intervals on the graph.
Fixed Y-scale sets a static Y-scale rather than automatic.
Transfer rate unit sets to displays bandwidth usage either in bytes per second or bits per second.
Graph Colours
In the Graph Colours tab you can specify the graph’s background, foreground and the other relevant colours by selecting them from the corresponding drop-down menus:
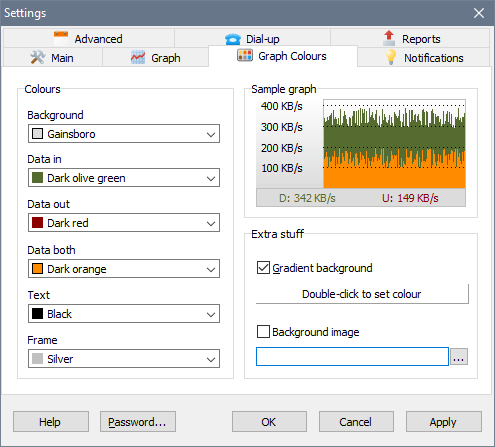
The ‘Data both’ represents the colour in which the value is shown when both In and Out traffic were recorded. For example if you set green colour for ‘Data in’, red for ‘Data out’ and orange for ‘Data both’, the chart will be shown as follows:
- When only incoming traffic is recorded, it is painted as a green bar.
- When only outgoing traffic is recorded, it is painted as a red bar.
- When both incoming and outgoing traffic are recorded, a part of the bar is painted orange and the top of that bar is either red or green, depending on which traffic prevails in that measurement.
This allows seeing both In and Out traffic on a single graph.